
Elections are a great time to get reacquainted with America.
As a rule, I think it’s important for people who follow and comment on politics to be intimately aware of public opinion data: you can’t talk about the country if you don’t first know what the country thinks. My goal is to make sure that Wake Up To Politics readers are carrying an as-accurate-as-possible mental model of the electorate with them at all times.
The great thing about elections is they are an irrefutable X-ray of what the country thinks: no margin of error or anything like that. Politicians from both sides spend months and months campaigning on a theory of public opinion: and then they we all get to see it tested in real time.
Polls can also help with this, of course, but they come with more room for error. One reason for that is that most national polls only include somewhere between 1,000 and 3,000 respondents, a relatively paltry sample size.
That’s why I was excited this year when the University of Chicago’s National Opinion Research Center (now known just as NORC) did something different: they ran a survey with more than 110,000 registered voters, across all 50 states. This gives us a view of the electorate that isn’t as reliable as an election result itself, but does ask more detailed questions (Why did you vote a certain why, not just how you vote?) and is much more comprehensive than the typical polls, which have a fraction of the respondents (which makes it harder to do demographic analysis, since there will be too few respondents in some subgroups to tell us anything helpful).
I’ve spent the last few days poring through over permutation of the NORC data — which asked an unusually large number of questions that can then be analyzed along an unusually large number of demographic divides — to try to come up with some interesting takeaways to help you better understand your country circa 2026.
Note that the poll included registered voters who didn’t plan to vote in 2026: for questions about 2026 vote choice, I’ve only included the (still very large) sample of likely voters, to limit the universe to people who planned to cast a ballot in the midterms. Unless so noted, percentages below are of registered voters overall, including people who didn’t plan to vote in 2026 (but, of course, could choose to vote in 2028).
Without further ado, here are 14 things to know about your country:
79% of Americans want “substantial change” or “complete and total upheaval” in how the country is run, compared to 21% who want no change or only small change.
Change voters overwhelmingly preferred Democratic House candidates in the midterms (64% to 34%), while stand-pat voters sided with Republicans (81% to 16%).
Still, majorities of both parties were on the “change” or “upheaval” side: 94% of Democrats and Democratic leaners, and 64% of Republicans and Republican leaners, plus 83% of Independents.
Somewhat amusingly, even 85% of self-identified moderates said they want change or upheaval, as did 94% of self-identified liberals and 64% of self-identified conservatives.
65% of voters who said their family’s financial situation was “falling behind” said they were going to vote for a Democratic House candidate, while 32% said they were going to vote Republican.
Meanwhile, 58% of voters who said their family’s financial situation was “getting ahead” said they planned to vote Republican for Congress, while 40% said they planned to vote Democratic.
Voters who said their family was “holding steady” broke Democratic, 53% to 45%.
Without the actual economic data for any of these voters, though, this presents something of a chicken-or-the-egg question: did people vote Democratic or Republican because they felt like they were struggling or doing well, or did they feel like they were struggling or doing well because they were a Democrat or a Republican (and therefore had differing opinions on the president)? We know from other polls that opinions of the economy are often driven more by partisanship than real facts on the ground.
76% of Americans are somewhat, completely, or very satisfied with the quality of life in their community, while only 23% are not too or not at all satisfied.
Meanwhile, only 38% of Americans are somewhat, completely, or very satisfied with how things are going in the country today, while 60% are not too or not at all satisfied.
60% of voters with a data center located in their county voted for a Democrat for Congress, compared to 49% of those with a data center within 100 miles and 31% of those with a data center farther than 100 miles.
However, opinions on data centers actually get slightly more negative the farther you are from one: Americans with a data center in their county were split 20%/55% on whether they supported a data center being constructed in their area; Americans with a data center within 100 miles were split 18%/56%; while Americans with a data center farther than 100 miles were split 17%/59%.
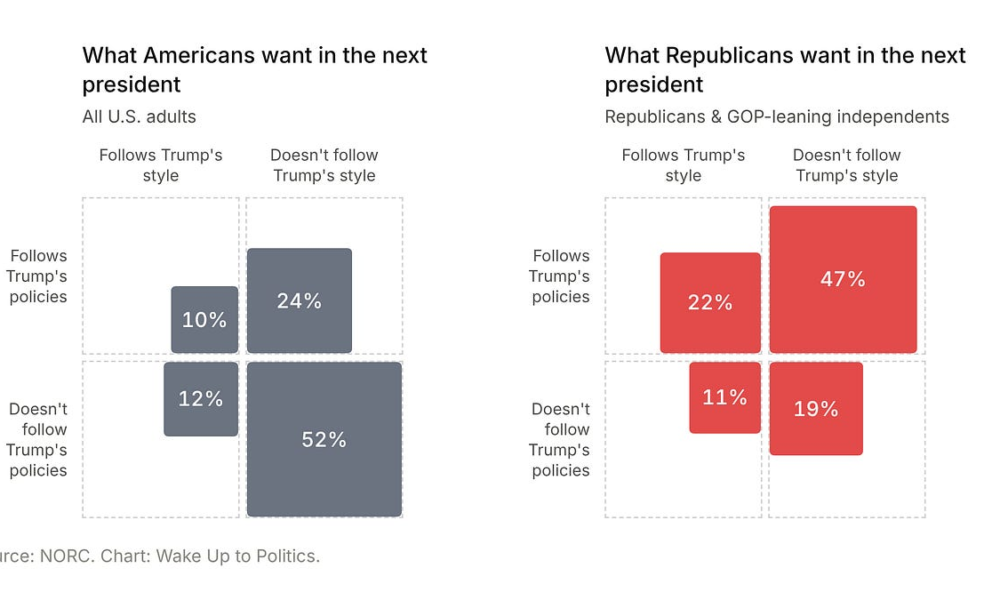
Asked whether they want the next president to be someone who follows Trump’s policies, style, neither or both, only 22% of Republicans and Republican-leaning Independents said they want a president who follows Trump’s policies and style, a somewhat striking result. The party may have sky-high approval of the president, but that doesn’t mean they’re looking for a sequel.
A plurality of Republicans (47%) want a president who follows Trump’s policies, but not his style, while 11% want someone who follows his style, but not his policies. 19% want someone who follows neither.
Among Americans overall, 52% want a president who doesn’t follow Trump’s policies or his style; 24% want someone who follows his policies, but not his style; 12% want someone who follows his style, but not his policies; and 10% want someone who follows his policies and style.
Notably, though the vast majority of Democrats want a president who follows neither quality of Trump’s, 12% of Democrats and Democratic-leaning Independents want a president who follows his style, but not his policies.
23% of Democrats said they had gotten into a political argument online or in-person in the last year, compared to 19% of Republicans.
Democrats were also more likely to have posted online about politics (24%) in the last year than Republicans (20%), and were more likely to say Republicans “live in a different world” from them (51%) than Republicans were to say the same about Democrats (48%).
Americans 65 and older are exactly evenly split: 46% are Democrats or lean Democrat, 46% are Republicans or lean Republican, and 8% are Independents.
Ditto Americans aged 45 to 64: 42% are Democrats or lean Democrat, 42% are Republicans or lean Republican, and 16% are Independents.
It is only among Americans under 50 that either party boasts a clear advantage, and even here, it is less lopsided than it used to be. Among Americans aged 18 to 29, the split (including leaners) is 45% Democratic / 32% Republican / 22% Independent. Among Americans aged 30 to 44, it’s 41% Democratic / 34% Republican / 25% Independent.
44% of Americans said the U.S. should take a less active role in solving the world’s problems, while 32% advocated for a more active role, and 22% said the current role is about right.
Notably, pluralities of both parties want a less active role in world affairs: 43% of Democrats and Democratic leaners (compared to 39% who want a more active role) and 45% of Republicans (compared to 25% who want a more active role), plus 42% of Independents (compared to 33% who want a more active role).
Contrary to some other poll results, this survey found that young voters (in both political tents) were actually somewhat more likely than older votesr to want the U.S. to play a larger role globally. The survey did align with others in finding that views on Israel were starkly polarized by age: 18-to-29-year-old Democrats and Democratic leaners are only six points more likely to categorize Israel as an “ally or a partner” (51%) than as “a rival or an adversary” (45%), compared to Democrats aged 65+, who are 47 points more likely to do so (72% say ally/partner, 25% say rival/adversary).
The same dynamic exists on the Republican side, where 18-to-29-year-olds are split 53%/43% on whether Israel is an ally/partner or a rival/adversary, while those 65+ are split 83%/10%.
A hidden factor in Scott Colom’s win in Mississippi, which made him the first Democrat to win a Senate race there since 1982 and the first Black senator from the state since Reconstruction?
Mississippi was the state with the most likely voters who said racism was one of the three most important issues facing the country. 19% of Mississippi likely voters selected racism on their list of three top issues, compared to a national average of 11%.
52% of 18-to-29-year-old men said that men face “a great deal” or a “moderate amount” of discrimination, the only subgroup for whom a majority gave that answer.
Majorities of all other age/gender groups said that men face “only a little” discrimination or “not at all.” Consider, for example, the divide between young men and men 65 and older, 74% of whom said that men face little or no discrimination.
A majority of 18-to-29-year-old women believe that racism is “built into our society, including into its policies and institutions,” as opposed to coming from “individuals who hold racist views, not from our society and institutions.” So do majorities of 45-to-64-year-old men and women.
But majorities of 18-to-29-year-old men, 30-to-44-year-old men, and 65+ men and women preferred the individualistic view of racism. 30-to-44-year-old women were evenly divided on this question.
The state with the largest percentage of registered voters who said immigration was one of the top three issues facing the country was … Wyoming, with 38%. It was followed closely by Montana (37%) and Nebraska (35%). Voters in North Dakota and Idaho were just as likely as voters in Arizona to spotlight immigration (33% in all three states) and more likely to do so than voters in Texas (where 32% said immigration was a top-three issue).
Overall, voters in counties that have seen an increase in Hispanic population over the last five years are only one percentage point more likely to call immigration a top issue than voters in counties that have seen a decrease in Hispanic population.
57% of Jewish Americans said that they could never vote for a candidate who holds different views from them on Israel/Palestine, compared to 51% of Muslim Americans.
16% of 18-to-29-year-olds said they regularly get political news and information from AI chatbots, compared to 12% of 30-to-44-year-olds, 7% of 45-to-64-year-olds, and 4% of those 65 and older.
Comment below with questions you are interested in seeing how the country or a specific subgroup answered, and I’ll try to respond with the relevant NORC data! NORC asked a bunch of questions about health care, the economy, immigration, abortion, AI, guns, foreign policy, and more — so if you’re curious about something, there’s a good chance NORC asked about it!
Leave a comment
Gabe, thank you for this insightful analysis. Could you please delve into the following in the NORC data: health care, foreign affairs, and where respondents get their news? RE the last item, I'm interested in how many people get their news from independent journalism like Parnas Perspective and Meidas Touch. Thanks.
What did Americans say about our national debt? What did they say about our government needing to cut spending? What did they say about the inherent inequalities in how taxes are collected?