New Marquette Law School national survey finds Democrats expand lead on congressional ballots; Trump approval declines – Marquette Today

Popular Searches
Law
Democrats open lead outside margin of error among both likely, registered voters
Also:
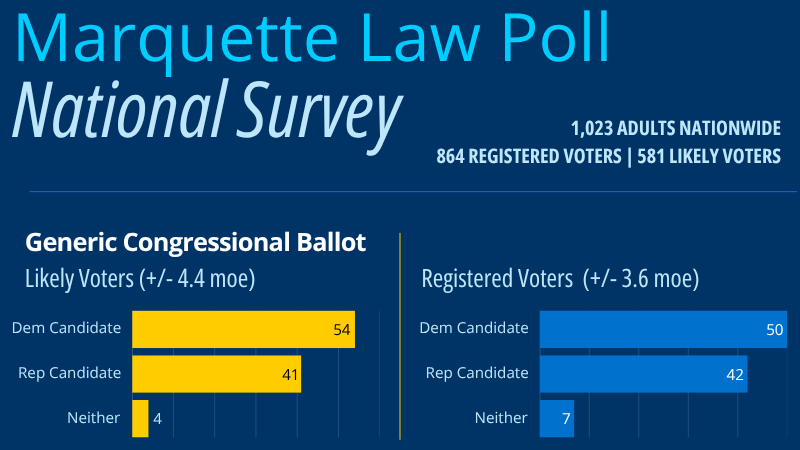
A new Marquette Law School Poll national survey finds 54% of likely voters saying they will vote for a Democrat in congressional elections in November, while 41% say they will vote for a Republican. In July, the Democratic advantage was 51% to 45%. The recent results for the congressional vote among likely voters are shown in Table 1. (All results in the tables are stated as percentages.)
Table 1: Generic congressional ballot
Among likely voters
Among all registered voters, Democrats hold a 50% to 42% advantage over Republicans, a larger margin than the 46% to 44% gap in July’s Marquette Law School Poll, as shown in Table 2.
Table 2: Generic congressional ballot
Among registered voters
The survey was conducted Sept. 2-9, 2026, interviewing 1,023 adults nationwide, with a margin of error of +/-3.3 percentage points. For registered voters, the sample size is 864, with a margin of error of +/-3.6. For likely voters, the sample size is 581, with a margin of error of +/-4.3 percentage points.
The Democratic advantages among all registered voters stem in part from stronger Democratic performance among independents, including both those who lean to a party and those who say they are not closer to either party. Among independents who lean to the Democratic Party, 90% support the Democratic Party candidate, while among independents who lean to the Republican Party, 83% say they will vote for the Republican congressional candidate and 10% are reluctant to vote for either candidate. Among independents who do not lean to either party, 41% favor the Democratic candidate and 10% the Republican, but 40% say they favor neither and 8% say they won’t vote.
In contrast, both Democratic and Republican partisans support their party’s congressional candidate at least 93% of the time, with very little crossover voting and with few saying they won’t vote, as shown in Table 3.
Table 3: Generic ballot, by party identification
Among registered voters
The substantial independent preference for Democratic congressional candidates is also seen when the six Marquette polls conducted in 2026 are combined, boosting the sample size and showing the September poll is in line with results all year. In the combined sample, 31% of independents favor the Democrat and 14% favor the Republican, while 46% say they prefer neither. The strong partisan loyalty seen in September is nearly the same in the combined polls, and those independents who lean to the Democratic Party report more Democratic votes than those who lean Republican favor the Republican candidate, as shown in Table 4.
Table 4: Generic ballot, by party identification, pooling all 2026 polls
Among registered voters
Which party is better
The Democratic Party is seen as doing a better job on six of 10 issues. Republicans are seen as better on three issues, and there is a tie on one. Democrats hold the advantage on the federal deficit, foreign policy, the economy, inflation, Medicare & Social Security, and health care. Republicans are seen as better on national defense, crime, and immigration and border security. The two parties are tied on which would handle taxes better, as shown in Table 5.
Table 5: Which party is better handling issues
Among adults
The Democratic advantage has grown across issues during 2026, while the Republican advantages have decreased. On each issue where Republicans are seen as better, the size of that advantage has declined since January, while each Democratic issue has seen a larger advantage over time. Table 6 shows the changes for each issue in 2026 polls.
Approval of the parties in Congress has also shown similar trends. In September, 36% approve and 64% disapprove of how the Republican Party in Congress handles its job, and identical totals of 36% approve and of 64% disapprove of Democrats in Congress. Both parties have seen substantial majorities disapprove throughout President Donald Trump’s second term. However, there has been a change in the approval ratings of both parties. Over the term of the 119th Congress, Republican approval has fallen from 45% in March 2025 to 36% in September 2026, while Democratic approval has increased from 29% to 36%. Approval of each party is shown in Table 7.
Table 7: Approval of congressional parties
Among adults
The Republican Party is seen as too conservative by 51% of adults, and the Democratic Party is seen as too liberal by 50%. About a quarter (28%) say the Republican Party is about right ideologically, and 22% say the Democratic Party is about right, as shown in Table 8.
Table 8: Is the Republican/Democratic Party too conservative/too liberal
Among adults
Those who identify with the parties are more likely to say their party is about right for them, with 62% of Republicans and 40% of Democrats saying this. Those independents who lean to either party are somewhat less satisfied with the party ideologically, and a quarter or less of independents say either party is right for them. Among Democrats, 46% say the Democratic Party is too conservative or too moderate for them, while among Republicans, 23% say the Republican Party is too liberal or too moderate. This shows substantially more desire among Democrats for a leftward shift in the party than among Republicans for a rightward shift in theirs. This is shown in Table 9.
Table 9: Is each party too conservative/liberal, by party ID
Among adults
The Democratic advantage in congressional vote among likely voters is aided by higher expected turnout among Democrats than among Republicans. Among registered Democrats, 77% say they are certain to vote in November, versus 69% among Republicans. Likewise, among independents who lean Democratic, 67% say they are certain to vote, compared to 60% among independents who lean Republican. Independents who don’t lean to either party are substantially less likely to say they are certain to vote, with just 41% sure they will go to the polls. This lower turnout among “pure” independents reduces their influence in elections below their size among all registered voters. These results appear in Table 10.
Table 10: Likelihood of voting in November elections
Among registered voters
Democrats also enjoy an enthusiasm advantage going into the fall elections. Forty-seven percent of Democrats say they are very enthusiastic about voting in the election, compared to 32% of Republicans. There is a more modest enthusiasm gap among independents who lean to a party, with a 29% to 23% advantage for Democratic leaners over Republican leaners. As with certainty of voting, pure independents are by far the least enthusiastic about voting, with just 14% very enthused, as shown in Table 11.
Table 11: Enthusiastic about voting in November elections
Among registered voters
Among Republicans and independents who lean Republican, turnout is highest among those who are very favorable to the Make American Great Again (MAGA) movement, with 82% of them saying they are certain to vote. This falls to 64% for Republicans only somewhat favorable to MAGA and to 52% among those unfavorable to MAGA. This shows that the turnout issue among Republicans comes from those less attached to Trump’s loyal base of MAGA enthusiasts. These results are seen in Table 12.
Table 12: Likelihood of voting among Republicans, by MAGA favorability
Among Republican registered voters
As with affection for MAGA, turnout among Republicans is strongly related to approval of Trump. Among those who strongly approve of the president, 81% say they are certain to vote, dropping to 61% among Republicans who somewhat approve and to 56% among those Republicans who disapprove of how Trump is handling his job. Among Republicans and independents who lean Republican, 36% strongly approve of Trump, 40% somewhat approve, and 24% disapprove (either somewhat or strongly). Turnout by approval is shown in Table 13.
Table 13: Likelihood of voting among Republicans, by Trump approval
Among Republican registered voters
The Democratic Party has seen fresh competition from democratic socialists in primaries in 2026, creating new divisions within the party. However, these divisions are not associated with differences in turnout, such as are seen among Republicans. There is very little difference in expected turnout among Democrats regardless of how favorable or unfavorable they are to democratic socialist candidates, as shown in Table 14.
Table 14: Likelihood of voting among Democrats, by democratic socialist favorability
Among Democratic registered voters
Trump approval in second term
Approval of how Trump is handling his job as president declined in September to 37%, with 63% who disapprove. That is down from 40% approval in July, and a percentage point below the previous low of 38% approval in May and June. The course of approval has been downward since the start of Trump’s second term, when 48% approved and 52% disapproved. This trajectory has not been marked by dramatic or sudden drops. The steadiness of the decline from poll to poll has been notable, with approval falling by 0 to 3 points across successive polls, with the exception of a 2-point increase in the July 2026 poll. While successive changes have been small, the cumulative decline is substantial, as shown in Table 15.
Table 15: Trump job approval in second term
Among adults
The strength of approval of Trump has also shifted over the second term. A substantial share of adults has strongly disapproved of Trump throughout 2025 and 2026, ranging from 40% in February 2025 to the current 47%. More change is seen in the balance of those who strongly approve and those who somewhat approve. Strong approval outweighed somewhat approval by 29% to 19% in February 2025, but as of September 2026, this is reversed, with 22% somewhat approving and just 15% strongly approving. This is a drop of almost half in strong approval since February 2025. The full trend is shown in Table 16.
Table 16: Strength of Trump job approval in second term
Among adults
Approval of Trump varies substantially across issues, with his highest approval rating, 49%, for his handling of border security, and 43% approval on the issue of immigration. Each of the other six issues measured has approval ratings below 35%, with overall approval at 37%. Approval is especially low for the economy, war with Iran, gas prices, and inflation and the cost of living, each of which has approval below 30%. While approval on border security and on immigration each has remained relatively stable, approval on other issues has seen significant decline over time. Approval of the war with Iran has declined from 32% in April to 26% now. These trends are shown in Figure 1 and Table 17.
Table 17: Trump approval ratings
Among adults
Americans are especially negative on Trump’s handling of inflation and the cost of living, with just 19% approving. A substantial 64% say his policies are increasing inflation, while only 18% think they are decreasing it. An additional 18% think Trump’s policies are not affecting inflation. This represents a sharp downturn in public opinion from the beginning of the second term, when twice as many, 36%, thought his policies would lower inflation, though 49% said he would increase inflation, as shown in Table 18.
Table 18: Effect of Trump policies on inflation
Among adults
There has been an especially striking change over the second term among Republicans in their belief whether Trump’s policies will decrease inflation. In December 2024, shortly after his reelection and before taking office, 76% of Republicans thought Trump’s policies would lower inflation. That percentage has fallen by more than half, to just 37% of Republicans who now think the president’s policies are reducing inflation. Among independents, only 28% thought Trump would lower inflation just after his election, but that, too, has fallen to 9% as of September. Democrats scarcely expected Trump to decrease inflation, declining from 8% to 3% now. These changes are shown in Table 19.
Table 19: Trump policies decrease inflation, by party identification
Among adults
Most important issues
Inflation remains by far the most important issue for Americans, with 37% ranking it first among 10 issues considered in the September poll. The second-highest-rated issue is the economy, at 16%, followed by the war with Iran at 10%. The high ranking of inflation has been steady throughout the year, and by a large margin in each survey. Concern over the war with Iran has declined from 24% in April to 10% as of September, while the importance of most other issues has remained relatively stable. The importance of issues, and the changes over the year, are shown in Table 20.
Table 20: Most important issue, throughout 2026
Among adults
Gasoline prices rose sharply with the start of the Iran war, and Americans are vividly aware of the change. In January, prior to the war beginning on Feb. 28, half of adults said gas prices had declined at least a little over the previous six months, a bright spot for the cost of living. In contrast, in May, 80% had said gas prices were up lot, and 95% said up a little or a lot. That sense of substantial increases has lessened somewhat as of September, with 15% saying prices have been about the same over the last six months, and 5% saying they have gone down a little. Yet 80% say gas prices have risen over the last six months since the start of the Iran war.
Grocery prices are also seen as rising, but more consistently over the year than for gas prices. As of September, 81% say their bill at the checkout counter is higher than six months ago, up from 70% in January. This consistent pressure on grocery prices is a clear source of concern over the cost of living, beyond the recent surge in gas prices. These trends are shown in Table 21.
Table 21: Change in price of gasoline and groceries
Among adults
Adults are also pessimistic about the course of inflation over the next 12 months, as 68% say inflation will increase in the next year. Only 12% are expecting a decrease, and 20% are expecting to see no change. This is a somewhat more negative outlook than in January, when 61% thought inflation would increase over the year, as shown in Table 22.
Table 22: Outlook for inflation in next 12 months
Among adults
More people say they are worse off than a year ago, 38%, than say they are better off, 19%, while 43% say they are about the same as a year ago. This two-to-one ratio of worse-to-better is a considerable shift from January, when 28% said they were better off and 34% said worse off, as shown in Table 23.
Table 23: Better or worse off than a year ago
Among adults
Iran war and foreign affairs
The public remains very doubtful that the United States has achieved its goals in the Iran war, with just 13% saying the goals have been reached and 87% saying they have not been achieved. This is down from 21% in April who thought the goals had been achieved, as shown in Table 24.
Table 24: Has U.S. achieved its goals in Iran war
Among adults
One in five, 21%, say the Iran war has been worth the cost, down from 28% who said so in May. This is seen in Table 25.
Table 25: Has Iran war been worth the cost
Among adults
Favorability toward Israel has declined sharply since March 2025, when 43% were favorable and an equal 43% unfavorable. As of September, only 29% are favorable to Israel and 59% are unfavorable. This movement has been steady over the last 20 months, as shown in Table 26.
Table 26: Favorability to Israel
Among adults
More say the United States is providing too much aid to Israel rather than not enough, as shown by two somewhat different questions asked since November 2023.
These results are shown in Table 27.
Table 27: Military aid to Israel
Among adults
Favorability to Ukraine has declined since March 2025 from 59% to 51%, with unfavorable views increasing from 31% to 36%, though on balance more remain favorable than unfavorable. This is shown in Table 28.
Table 28: Favorability to Ukraine
Among adults
Views on U.S. aid to Ukraine has varied over the course of the war since Russia invaded in February 2022. In each poll from November 2022 through March 2025, more said the U.S. was providing too much support to Ukraine than said not enough support. In September and November 2025 this reversed with more saying there was not enough aid. In September 2026, a slightly different wording asked about military aid to Ukraine, with 35% saying not enough and 33% saying too much military aid was going to Ukraine. Often the largest group said about the right amount of support was being given, in the 40%-46% range in 2022 and 2023, though this declined in 2024 and since. These trends are shown in Table 29.
Table 29: Military aid to Ukraine
Among adults
The wars between Russia and Ukraine, and between the United States and Iran, have demonstrated the importance of drone aircraft in both conflicts. The U.S. has been slower to develop low-cost drones than these other countries, relying instead on more expensive munitions. With the Iran war draining supplies of U.S. armaments and the apparent success of Ukraine’s low-cost drones in their war with Russia, Americans were asked if the U.S. should ask Ukraine for assistance in developing cheaper but effective drones. A majority, 57%, say the U.S. does not need Ukraine’s assistance, while 43% says the U.S. should ask for Ukraine’s aid. Larger majorities of Republicans and independents say the U.S. does not need help, with a slight majority of Democrats say the U.S. could use the help, as shown in Table 30.
Table 30: Ask Ukraine for aid building drones, by party identification
Among adults
News attention
The death of Dolly Parton gained the most attention to news stories this month, with 78% saying they heard a lot about it, while just 5% heard nothing at all. Attention was also widespread with only small differences by party, age, education, or source of news. In contrast, the pennant races in Major League Baseball received the least attention of nine topics, with just 7% hearing a lot and 69% nothing at all. Substantially more, 31%, heard a lot about the start of the NFL season.
Other topics receiving substantial attention include the war with Iran, with 67% hearing a lot; new tariffs on Canada, 51% hearing a lot; and Trump announcing he was renaming Lake Ontario, 50% hearing a lot. Less visible topics include the national debt reaching $40 trillion, 35% hearing a lot, and the projected depletion of the Social Security trust fund by 2032, 22% hearing a lot. Less attention was paid to the announcement by Alexandria Ocasio-Cortez that she would freeze her eggs. Attention to these topics is shown in Table 31.
Table 31: Attention to topics in the news
Among adults
Attention to events varies across sources of news and across topics. Parton’s death was quite visible regardless of news source, ranging from 74% to 89% hearing a lot. Attention to news about the war with Iran varied more, from 92% of MS Now viewers hearing a lot to 73% of Fox News viewers and 69% of those who rely on social media for news. Similar variation is seen for news of tariffs on Canada and renaming Lake Ontario. And news of the national debt passing $40 trillion was heard a lot by 66% of MS Now viewers but only by 34% of the Fox News audience. These comparisons are shown in Table 32.
Data centers and industrial development
The public remains strongly skeptical of the building of data centers, with 71% saying the costs outweigh the benefits and 29% saying benefits outweigh the costs. In January, 62% said the costs were higher than benefits, as shown in Table 33.
Table 33: Benefits and costs of data centers
Among adults
Views as to whether artificial intelligence is good or bad for society have fluctuated slightly since April, with 64% in September saying AI is bad for society and 36% saying it is a good thing. This trend is shown in Table 34.
Table 34: Is AI a good or bad thing for society
Among adults
Despite the skepticism about AI, a growing majority of the public says they have used an AI app in the last month, with 69% in September saying they are users—up from 61% in April. Table 35 shows this change.
Table 35: Does respondent use AI
Among adults
Users of AI are considerably more likely to say AI will be a good thing for society, but, even among users, more say AI is a bad thing, 56%, than a good thing, 44%. Non-AI users are especially negative about AI’s impact, with 81% saying it will be bad for society, as shown in Table 36.
Table 36: Is AI good or bad for society, by use of AI
Among adults
The public is also strongly opposed to Flock cameras, which record license plates from passing cars and are used by police agencies across the country. Thirty-nine percent say these cameras are an important tool for police investigations, while 61% say they are unacceptable violations of privacy rights.
The public sees relatively limited benefits from data centers. Asked which two of six possible benefits were most important, 33% said maintaining U.S. leadership in AI, and 30% said the digital economy relies on data centers. Fewer, 29%, selected the creation of permanent jobs at data centers, and 19% said construction jobs were an important benefit. Least-mentioned benefits were local tax revenue at 15% and the establishment of new industry in their state, at 14%. A substantial 23% said none of these six considerations were benefits of data centers. These opinions are shown in Table 37.
Table 37: Benefits of data centers
Among adults
As for the costs of data centers, the most frequently cited aspect was high water use by 54%, followed by driving up electricity costs, with 51%. Less often cited was replacing rural or agricultural land, selected by 30%. Least-mentioned were tax subsidies, 14%, the creation of few permanent jobs, 14%, and noise from data centers, 13%. Given this list of potential costs, 7% said none of these six were important costs of data centers. The perceived costs of data centers are shown in Table 38.
Table 38: Costs of data centers
Among adults
Data centers are not the only potential industrial developments opposed by a majority of American adults. The survey asked about five possible large industrial or commerce developments: chip fabrication plant, automobile manufacturing plant, e-commerce fulfillment center, steel or aluminum mill, or a data center. Each development consumes substantial land and resources while providing jobs and economic development. Respondents could select none, some, or all of the developments for what they would like to see in their area.
Of the five development options, no particular one was supported by even 33%, while 44% said they would not like any of these developed. Fifty-six percent selected at least one of the five options.
The most preferred development is computer chip fabrication plants, with 31% selecting that option, while 26% would like an automobile manufacturing plant and 26% favored development of an e-commerce fulfillment center. Less popular was a steel or aluminum mill, selected by 16%. The least popular option was data centers, at 12%. These choices are shown in Table 39.
Table 39: New industrial developments in area
Among adults
Industry or manufacturing has been a backbone of American blue-collar employment for decades, and it is striking that there is very little difference in preference for these five operations between those polled who have or do not have college educations. An identical 44% of non-college and college-educated adults say they would want none of these developments in their area. College graduates are somewhat more in favor of chip fabrication plants than are non-college graduates, while non-graduates are bit more favorable to auto manufacturing or steel and aluminum mills. Neither group likes data centers, as shown in Table 40.
Table 40: Favored industrial developments, by education
Among adults
About the Marquette Law School Poll
The survey was conducted Sept. 2-9, 2026, interviewing 1,023 adults nationwide, with a margin of error of +/-3.3 percentage points. For registered voters, the sample size is 864, with a margin of error of +/-3.6. For likely voters, the sample size is 581 with a margin of error of +/-4.3 percentage points.
Interviews were conducted using the SSRS Opinion Panel, a national probability sample with interviews conducted online. Certain other data from this survey (focusing on those about public views of the Supreme Court) are held for release on Sept. 17. The detailed methodology statement, survey instrument, topline results, and crosstabs for this release are available on the Marquette Law Poll website.
Campus Life
Lunchtime gallery talk by Prof. Felicia Caponigri: ‘Iké Udé: Sartorial Anarchy,’ Sept. 22
Campus Life
Campus Partner Spotlight Series: Marquette Core Curriculum and University Honors Program, Sept. 22
Campus Life
Iconic 1934 Packard from famous 1977 championship photo to visit campus Sept. 18
© 2026 Marquette Today. All rights reserved.